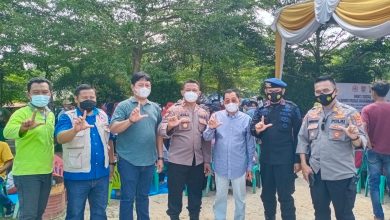
Polres Tubaba berenergi dengan Dinas Kesehatan melaksanakan Vaksinasi Dosis ke-2 secara serentak
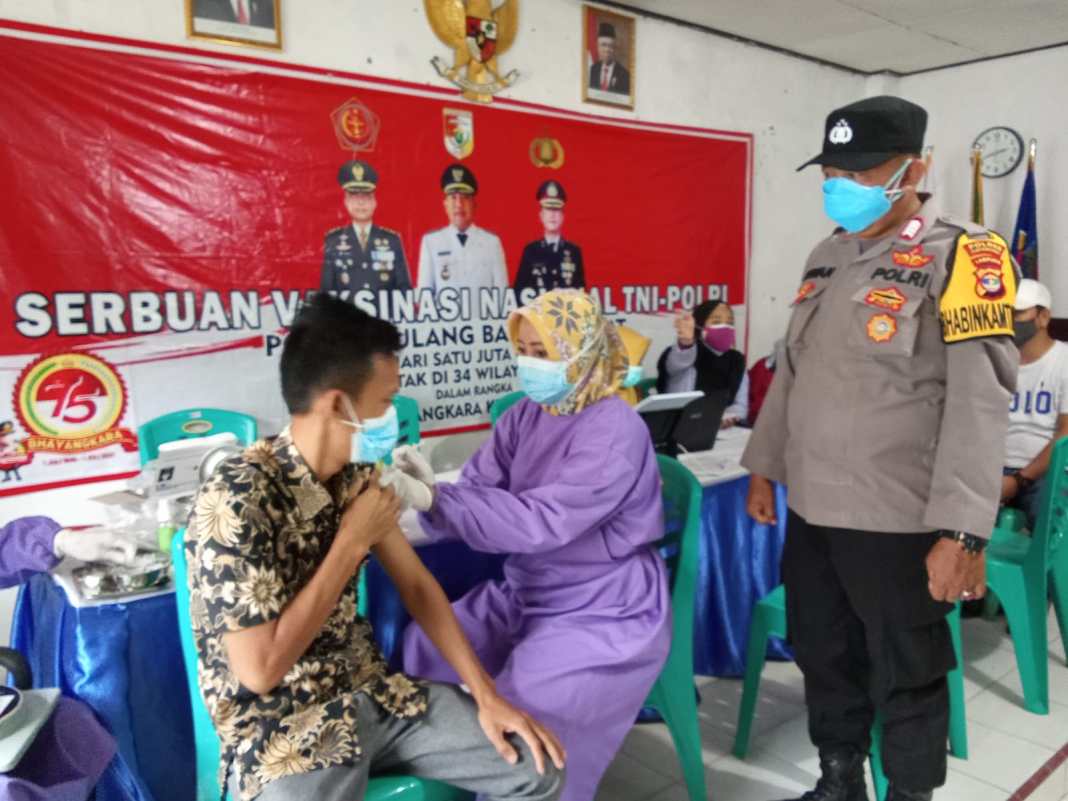
Corongrakyat.id|Tubaba,-Polres Tubaba bersinergi dengan Dinas Kesehatan (Dinkes) telah melaksanakan Vaksinasi dosis 2 (dua) secara serentak di Kabupaten Tulang Bawang Barat, Lampung. Sabtu, (24/07/2021).
Dalam kegiatan Vaksinasi berlangsung, Polres Tubaba bekerjasama dengan Dinkes Tubaba serta Panitia Tiyuh melaksanakan vaksinasi dosis ke 2 (dua), sebanyak 711 dosis vaksin yang diberikan kepada masyarakat Tulang Bawang Barat terbagi di 3 (Tiga) tempat, yakni Tiyuh Pulung Kencana, Tiyuh Kibang Budi Jaya, dan Tiyuh Tunas Jaya.
Kapolres Tubaba AKBP Hadi Saepul Rahman. S .IK, melalui Kasubbag Humas Polres Tubaba IPDA Dian Purnama.,menyampaikan, terima kasih kepada masyarakat yang antusias serbu vaksinasi massal secara gratis, yang kita selenggarakan, bersama Dinkes Tubaba, yang ikut berpartisipasi dalam melaksanakan Vaksinasi Nasional secara serentak seluruh Indonesia.
“Terima Kasih kepada masyarakat Tim Tenaga Medis yang membantu mensukseskan program vaksinasi ini. Saya mengapresiasi kegiatan tersebut. Sebab, antusiasme masyarakat Tubaba cukup tinggi. Bagi masyarakat yang sudah melakukan vaksinasi dosis 2 (dua) diharapkan agar selalu menerapkan protokol kesehatan (prokes)”, ujarnya Kasubbag Humas.
Sesuai instruksi dari Presiden, hari dilaksanakannya vaksinasi massal secara menyeluruh dengan target mencapai target yakni 711 dosis yang akan diberikan kepada masyarakat Tubaba.
Kasubbag Humas Polres Tubaba mengingatkan untuk tetap mematuhi protokol kesehatan. Pihaknya juga mengapresiasi para panitia yang ikut dalam bertugas untuk mensukseskan vaksinasi massal ini, sebagai penyelenggaran vaksinasi massal dan warganya yang dengan kesadaran sendiri ikut berperan aktif dengan melakukan vaksinasi.
“Vaksinasi diharapkan dapat membentuk herd immunity dan masyarakat terhindar dari Covid-19, dan untuk masyarakat jangan takut divaksin”, paparnya.
Kapolres Tubaba melalui Kasubbag Humas Polres Tubaba, berharap dan menghimbau bagi masyarakat yang telah mendapatkan vaksin Covid 19 tetap waspada dan menjaga kesehatan serta menerapkan protokol kesehatan.
“Bagi yang sudah divaksinasi Covid 19, agar tetap menjaga prokes, yakni 6 M. Mencuci tangan dengan sabun, memakai masker, menjaga jarak, menghindari kerumunan, mengurangi aktivitas diluar rumah dan melaksanakan vaksin. Demi kebaikan kita bersama serta untuk memutus mata rantai Covid 19”, jelasnya Kasubbag Humas.(Red)